An Introduction to Basic Tools Every Data Analyst Should Know About

An Introduction to Basic Tools Every Data Analyst Should Know About
Every data analyst has his or her own unique set of skills. Some analysts excel at jotting down notes and organizing large amounts of data while others are more comfortable with a more hands-on approach.
No matter what your style is, there’s likely a useful tool you could add to your repertoire. The best analysts are always looking for new ways to make their jobs easier and more efficient, even if they might not be aware of it yet.
That’s where this blog comes in! This article will give you an introduction to some basic tools every analyst should know about, as well as how they can help make your life as an analyst easier.
Some tools we will look at includes:
- Microsoft Excel
- Microsoft Power BI
- SQL
- Tableau
- Python
- R
Microsoft Excel

Microsoft Excel is a spreadsheet program that allows you to create, edit and view data tables. It has many functions that allows for application of advanced calculations, such as calculations with fractions or percentages, generating graphs, etc.
Excel is one of the most popular tools for data analytics because it is easy to use and has many features that make it powerful. However, because it was designed for business users, it can be difficult for people with no experience with Excel to learn how to use it efficiently.
Using excel, it is possible to analyze a large amount of data and draw conclusions. This software is widely used in business, accounting, and in the field of statistics. In addition, you can use excel in a creative way, for example, you can create a quiz with questions and graphs to help people learn information or improve their memory.
Excel can be used to analyze data in many different ways. The most common type of data analysis you’ll do is looking at data to see if it meets certain criteria. For example, you might look at a sales report to see how many items were sold, how much they were worth, and if the amount sold met your expectations.
Microsoft Power BI

Microsoft Power BI is a data visualization and reporting tool that comes with the Microsoft stack. There are a number of ways in which you can use this tool to extract insights from your data.
Power BI allows you to create and analyze data visualizations and reports in an easy and intuitive manner. These reports can be shared and accessed by the various team members.
The reports created on Power BI can be viewed on any device with an internet connection. You can create reports on data stored in SQL, Excel, or any other file type.
You can also create dashboards, which are a collection of reports. You can create different types of dashboards as per your requirement, such as a sales dashboard, a finance dashboard, and so on.
With Microsoft Power BI, you could play around with the data visuals and create animations. You can also customize the report layout and design, so that it suits you and your business requirements.
Tableau
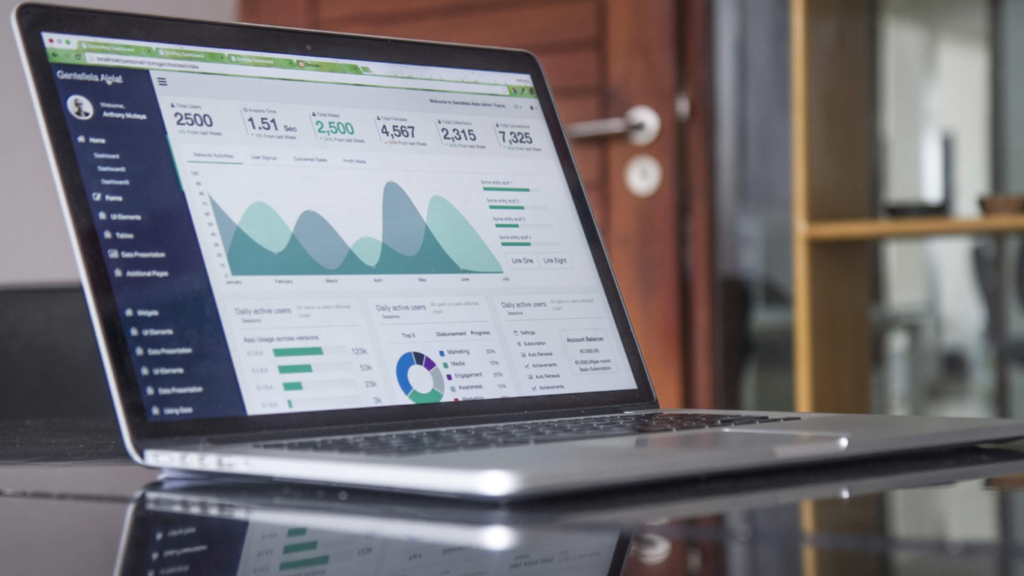
Tableau is a data visualization software that can be used by anyone. With Tableau, you can create charts, graphs, and dashboards that summarize your data. This helps in making decisions and seeing trends in data.
Tableau software makes it easy to visualize data. Data visualization is its main strength. It can be used to present information to stakeholders, customers, partners, etc. It is easy to understand because data is shown graphically instead of a list of numbers.
With Tableau, data can be stored in a variety of formats, such as Excel, CSV, JSON, etc. Once data has been standardized, it can be transformed into a format that is easy to work with.
Tableau can be used for any type of analysis. For example, if you want to know the sales for each month, you can set up a dashboard and select the month. Tableau then shows you the sales for that particular month.
SQL

SQL is a language that is used for querying and manipulating data. It is a standard language that is widely used to access data from relational database systems.
SQL is a standard language and any database system supporting it will allow you to input and output data using this language. This makes it a very popular language for data analytics.
A data scientist uses SQL to query and manipulate data in a database to answer a business question.
There are many benefits that come with the usage of SQL in your data analysis. It allows you to extract data, ensure data integrity, and query data for better understanding.
It enables you to design and create structured reports with ease. It allows you to create triggers and permissions to protect data. It is a standard language that is used around the world.
Python

Python is a high-level programming language which is faster than the other languages like C, C++, and Java. Python is also easier to learn than other languages as it has a simple syntax. End users can easily work on the python code.
Data analysis in python can be done in two ways. You can either use the libraries provided by the company which develop the python software or you can write the code yourself.
Python is highly customizable, which means you can change the way it looks and works as per your requirement.
Many companies use python for building data processing pipelines. These data processing pipelines can be used for data analysis. It enables data scientists to build various data analysis tools. These data analysis tools can be used for data exploration.
R Programming
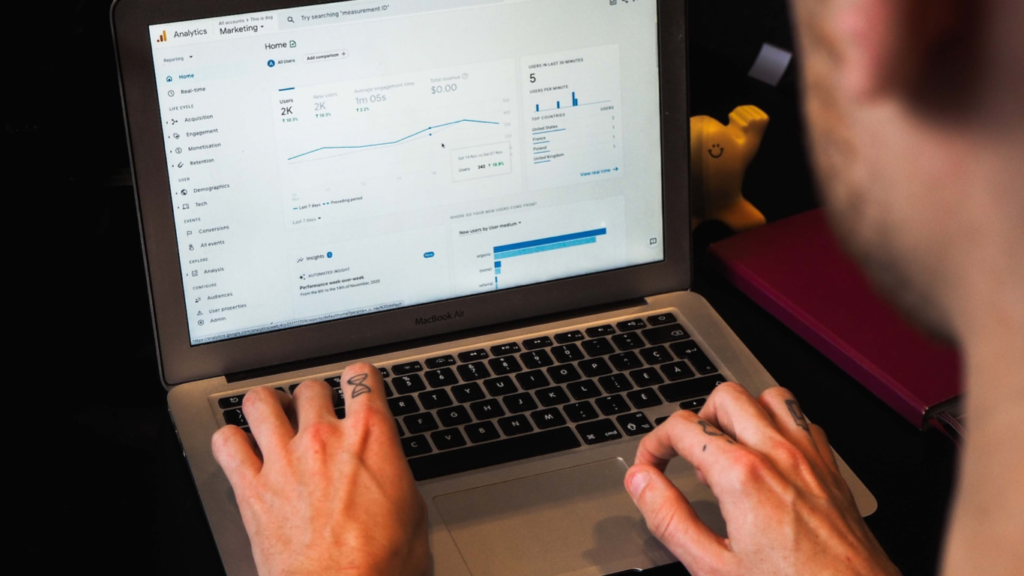
R is a software that can be used for data analysis, visualization, and modeling. Data scientists use R programming to perform data analysis and visualization tasks.
Data analysis is an important activity in data science. If you are trying to solve a business problem and you have the right data, you can use R to perform data analysis tasks.
The following are some of the important tasks in data analysis that R programming can help with.
Data profiling: R can be used to profile the type, length, and contents of your data. This will help you understand the data better and create better models.
Data visualization: A visualization is a static or interactive depiction of data. With R,, you can create dashboards, reports, and visualizations that are informative and easy to understand.
Data exploration: Data exploration is when you explore the data by exploring the shape and structure of the data. R helps you identify potential problems in your data and discover new insights.
Conclusion
It’s advisable to have a basic idea of how these tools/softwares work to be a good data analyst.
Some notable mentions of tools you can also master as a data analyst include: Jupyter Notebook, Qlik, SAS Business Intelligence, IBM Cognos Analytics, Oracle Analytics Cloud, Apache Spark, Sisense, and so many more.
You can check our courses catalog and pick up a course to master any of these tools and kickstart your career as a data analyst.

