How Data Visualization Empowers Informed Decision-Making
10/27/2023 2023-10-27 15:20How Data Visualization Empowers Informed Decision-Making

How Data Visualization Empowers Informed Decision-Making
In today’s fast-paced digital landscape, data is more than just numbers; it’s a valuable asset that drives businesses toward success. Amidst the vast sea of information, the ability to identify trends and patterns is crucial. This is where data visualization steps in, transforming raw data into actionable insights. In this blog post, we will explore the realm of data visualization, unraveling its significance, techniques, and real-world applications.
Introduction to Data Visualization
At its core, data visualization is the art of representing complex data in graphical and interactive formats. It’s a powerful tool that enables businesses to grasp the bigger picture. In a world overflowing with information, the importance of data visualization cannot be overstated. By simplifying intricate data sets into comprehensible visuals, businesses can identify trends, outliers, and hidden patterns.
Understanding Trends and Patterns
Identifying trends and patterns is akin to deciphering a puzzle. Businesses that can discern these nuances gain a competitive edge. Data visualization simplifies this intricate process. By using charts, graphs, and maps, professionals can translate raw data into visual stories. For instance, an e-commerce company can use bar charts to display top-selling products, pie charts for demographic breakdowns, and line graphs for sales trends over time. These visual representations illuminate correlations and outliers, guiding businesses toward data-driven decisions.
Utilizing Data Visualization Techniques
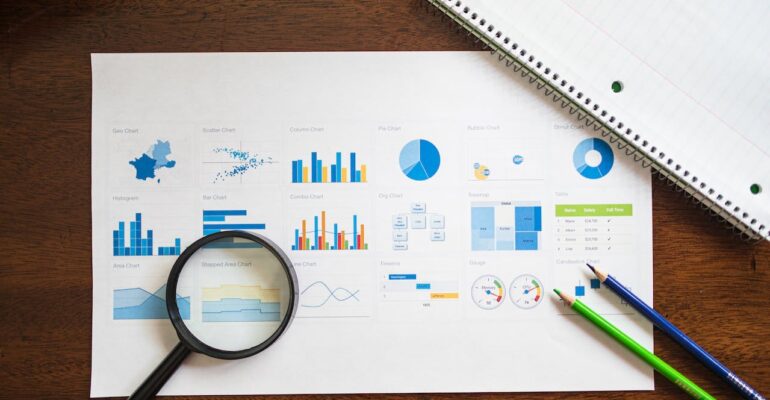
The world of data visualization offers a myriad of techniques, each tailored to specific data types and analytical goals. Bar charts are excellent for comparing categories, while line graphs highlight trends over time. Heat maps reveal density and patterns, and scatter plots showcase relationships between variables.
Consider a marketing team analyzing customer engagement. Utilizing heat maps, they can pinpoint the most-clicked areas on a website, allowing for targeted improvements. Combining these techniques amplifies the depth of analysis, offering nuanced insights that drive strategic decisions.
Implementing Data-Driven Decisions
Identifying trends and patterns is merely the beginning; the true power lies in implementing data-driven decisions. This involves a systematic approach:
- Analyze Visualized Data: Thoroughly examine the visual representations. Look for recurring patterns, sudden deviations, or customer behaviors that stand out.
- Draw Relevant Conclusions: Translate visual insights into actionable conclusions. Understand what the data is telling you about customer preferences, market trends, or operational efficiencies.
- Integrate Insights into Strategies: Align data-driven insights with business objectives. Optimize marketing campaigns, streamline operations, or enhance product offerings based on the visualized data.
- Monitor and Adapt: Continuously monitor the impact of implemented strategies. If certain approaches yield positive results, scale them. If not, analyze why and adapt accordingly.
Conclusion
Data visualization is not merely a tool; it’s a compass guiding businesses through the complexities of the digital landscape. By understanding the significance of trends and patterns and harnessing various visualization techniques, businesses can make informed decisions that fuel growth.
In the ever-evolving business ecosystem, data visualization isn’t just an option; it’s a necessity. It transforms businesses from reactive entities to proactive innovators, ensuring they stay ahead of the curve. Embrace the power of data visualization, and let your business thrive in the data-driven future.

